Product · Module
Analytics
Live KPI dashboards, multi-sheet Excel exports, multi-page PDF reports, scheduled email delivery, and a natural-language query bar that actually answers the question.
Capabilities
What analytics ships with
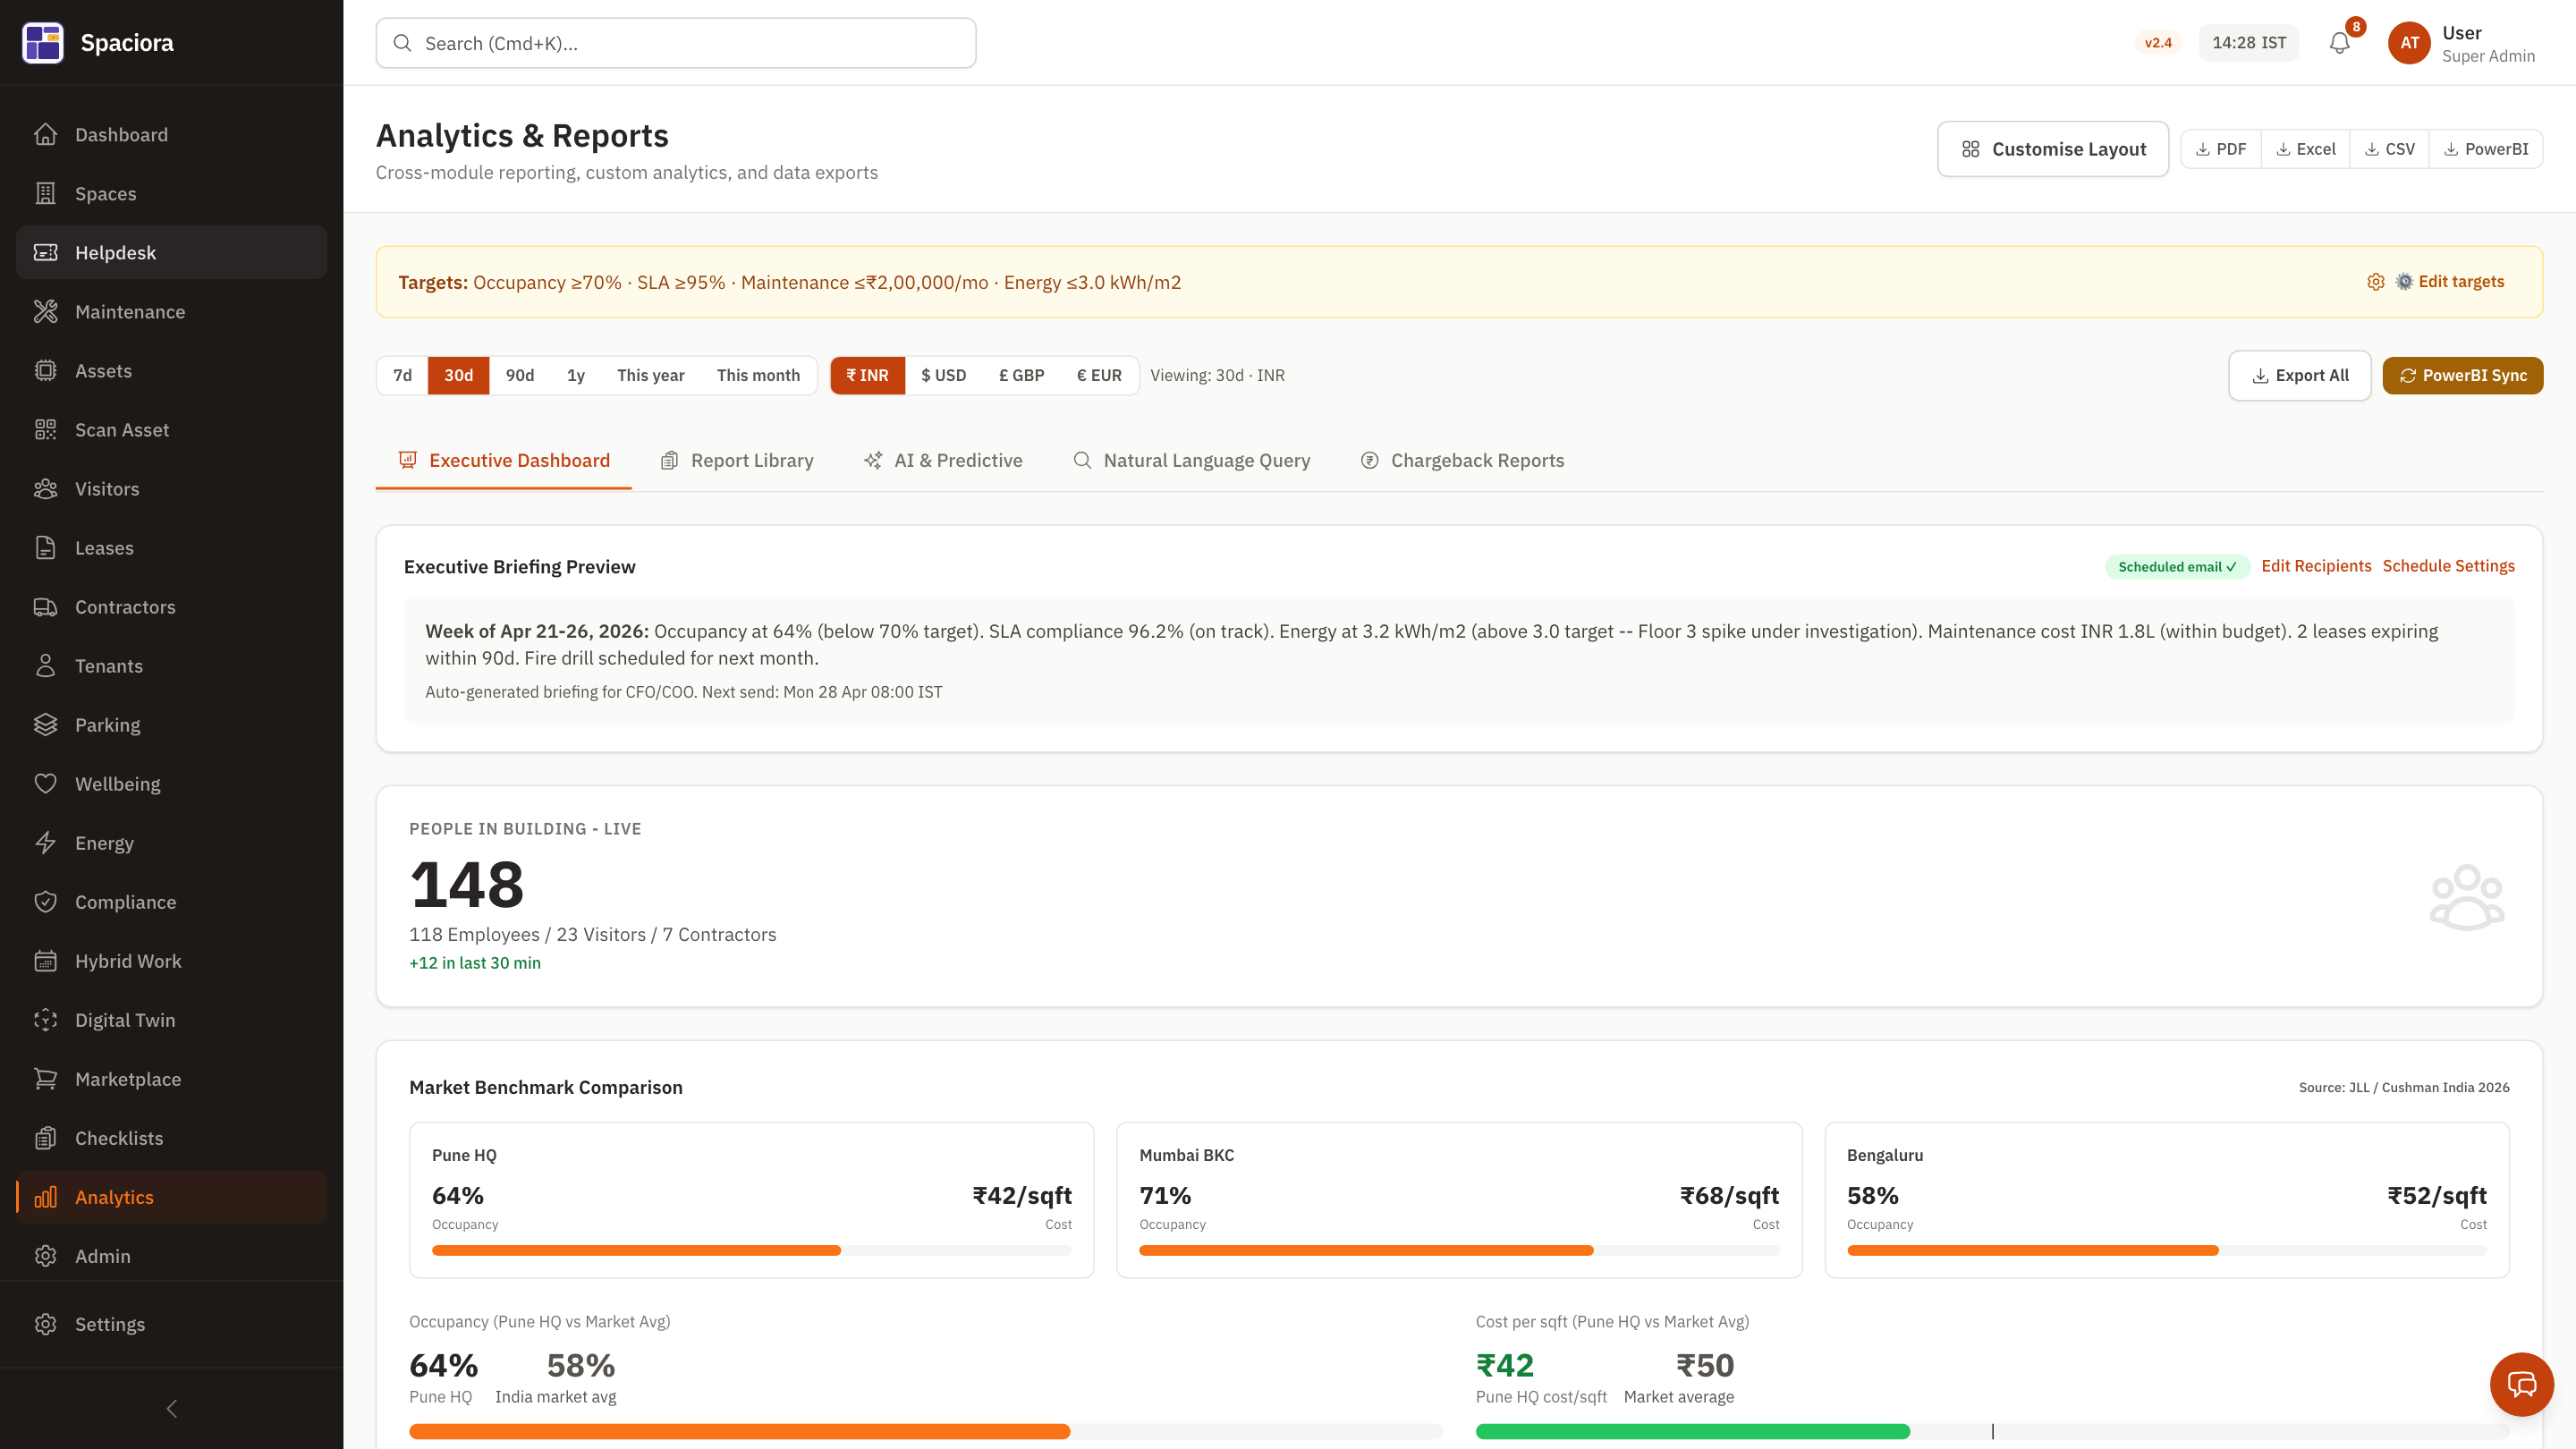
Executive dashboard
Live KPIs across space, maintenance, helpdesk, energy, ESG. One screen for the operations review.
Multi-sheet Excel export
7 worksheets (Summary, Helpdesk, Maintenance, Space, Energy, Tenant, Contractor) — one click, ready for the audit pack.
Multi-page PDF report
Same data, executive layout. Letterhead, signature block, footer with date stamp.
Natural-language query
Ask in English; Spaciora converts to SQL and runs against your data, with the SQL surfaced for review.
Scheduled delivery
Daily / weekly / monthly digests to email or a Teams channel — KPIs you actually look at, on the cadence you actually want.
Anomaly detection (rule-based)
Statistical detection (mean ± 2σ) flags energy spikes, ticket bursts, and SLA-breach trends. Honest threshold logic — no black box.
How it works
Implementation in days, not months
- 1
Trust the data
Spaciora aggregates from every module; numbers reconcile because they come from one source.
- 2
Pick or build KPIs
Use the standard set or compose your own with the formula bar. (Drag-resize Dashboard Builder ships in v1.1.)
- 3
Schedule digests
Daily, weekly, monthly — to email or to a Teams channel.
- 4
Drill from chart to row
Every KPI clicks down to the underlying records. No dashboard dead-ends.
An honest note on intelligence
Natural-language query is LLM-backed (Anthropic Claude). Generated SQL is shown to the user before execution; nothing is auto-run on production data without review. The drag-resize Dashboard Builder and the schedule-aware Report Builder both ship in v1.1.
Ship analytics in your portfolio.
Talk to our team. We'll show Spaciora running on your real data within an hour.
14-day free trial · No credit card · Multi-region residency